This post is somewhere between a guide and a collection of notes, aimed at debugging programs for AVR microcontrollers (like the ones in most Arduinos) “on target”. We’ll be using an AVR Dragon connected to the target micro via the normal 6-pin programming header, with a Mac or Linux PC as the host.
Although this is a bit more advanced than most of our other projects, it’s really quite approachable and is a very powerful technique for fixing AVR software problems.
From a high level; we’ll use a debugging program on a Mac (or Linux, Windows, etc) “host” computer, which communicates with a Dragon “In Circuit Emulator” (ICE) via USB to debug a buggy program running on the “target” AVR, which is presumably running in some circuit we’re interested in. Small variations might apply for Windows hosts, using JTAG instead of DebugWIRE, other debugger tools (Atmel JTAGICE mkII for example), etc.
Prerequisites:
- A desire to debug an AVR “on target”
- An AVR Dragon – these are really powerful and relatively inexpensive (~$50USD), if a bit fragile, tools for working with AVRs
- avarice and avr-gdb (both free and open source) installed, in addition to the typical AVR development toolchain (avr-gcc, avrdude, etc)
- Some conditions on what can be connected to the AVR’s reset pin during debugging
Why would we want to debug on target? I’ll redirect to a tutorial on GDB, which might be handy reading later on too, and note that some AVRs only have 6 IO lines to further limit the printf()-type options.
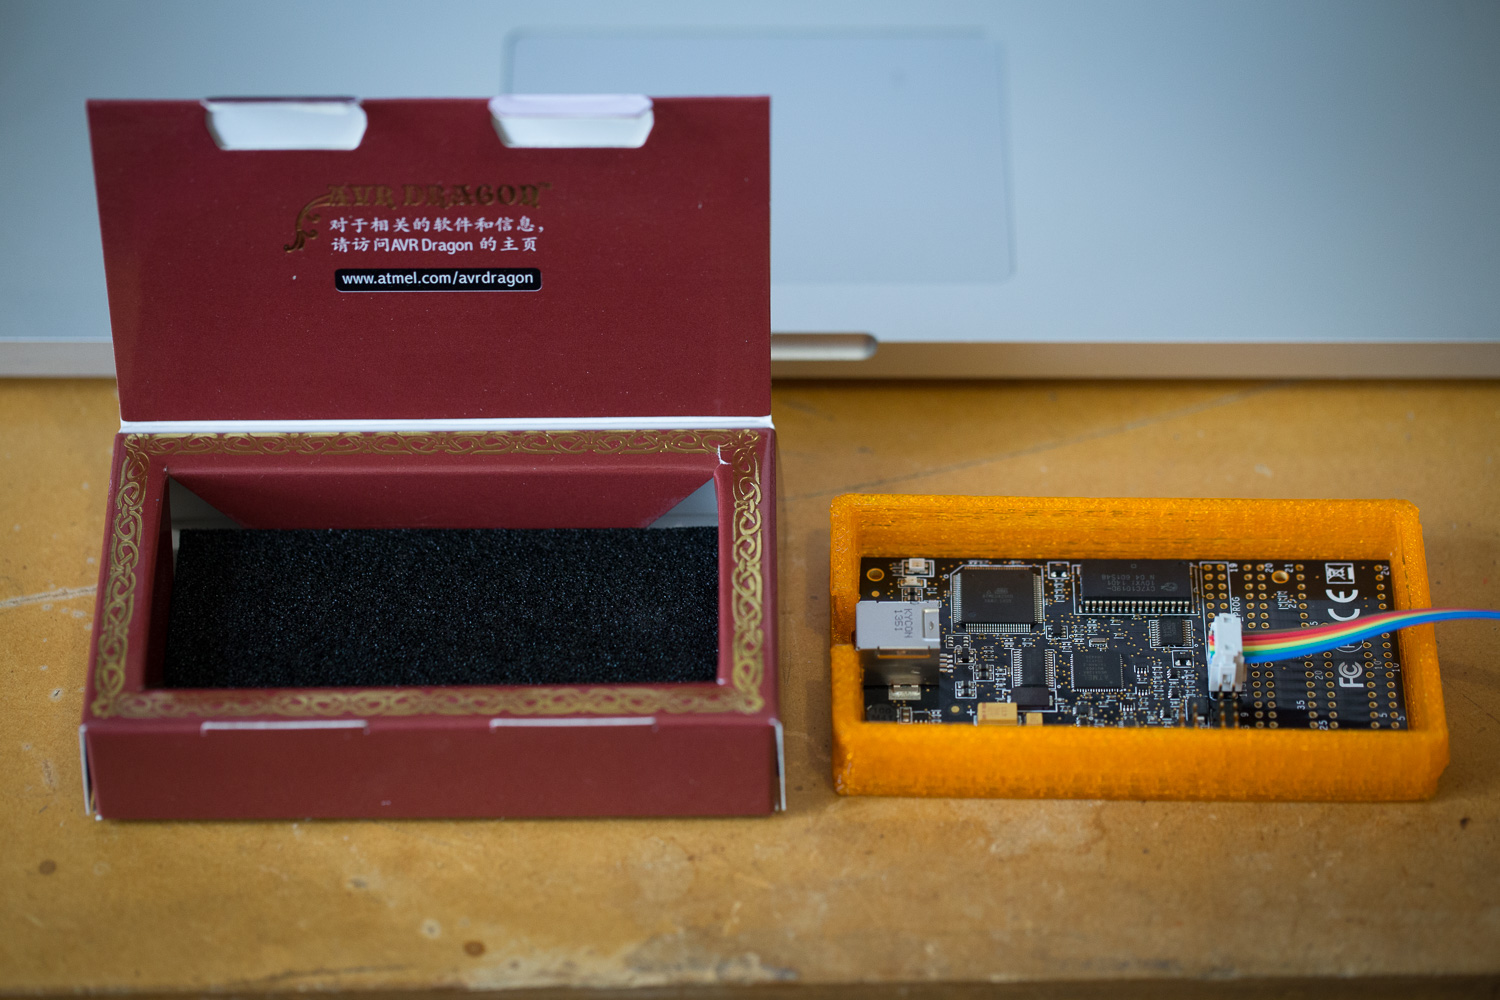
Dragons are, despite the name, quite fragile devices (if you break one, fixes for common issues are here. I’ve got some spare analog switches, no reason). First off, the Dragon comes as a bare PCB with lots of exposed pads and chips. While it’s tempting to keep the Dragon safe in the artistically designed box, the foam in the box is conductive, as is the gold foil all over the box. So, I’d suggest making up some sort of enclosure along the lines of my Fabulous Dragon Pen. You’ll also want a rather short cable to the micro, an adequately powered USB port, and be sure to use the 2×3 pin ISP header on the Dragon, not the 2×3 pin power header that’s right next to it.
We’ll be using the classic gdb debugger for this exercise; if you aren’t familiar with gdb then it’s probably a good idea to take a brief diversion to try using it to debug a regular C/C++ application on your computer, and maybe also ddd. gdb isn’t capable of talking directly with the Dragon, but it is capable of working over a network socket. That’s where avarice comes in – avarice provides a gdb-compatible network interface to the Dragon. Both are easy to install via MacPorts ($sudo port install avr-gdb avarice) or Homebrew (I presume $brew install avr-gdb avarice) on Macs, or the usual package manager for your favourite Linux distro.
DebugWIRE is Atmel’s proprietary interface, which the Dragon (or JTAGICE MkII) can use to communicate with the smaller target AVRs that don’t support JTAG. DebugWIRE transfers data through the AVR’s reset pin, which means that we can’t use the reset pin for anything else while using DebugWIRE. Further, there are some limitations on the capacitance that can be present on the reset pin while debugging. It’s recommended that the only things connected to the AVR’s reset pin are a >10k resistor to VCC, and the ICE. Note for Arduino folks: Arduino boards often have a capacitor between the UART and AVR, to facilitate resetting/programming the AVR over USB. Conveniently, there’s a trace that can easily be cut, and jumpered back later.
Another electrical detail is that the Dragon needs to see voltage on the VCC pin of the ISP header, so that it can behave appropriately for both 3.3V and 5V targets. My older AVR programmer didn’t care about the VCC pin, and I had gotten into a habit of leaving it unconnected as a result. D’oh!
So, on to debugging!
First, we need to build a debug version of the executable, both to load onto the micro (the .hex) and to let gdb know what it’s looking at (the .elf). Add a ‘-g‘ to your avr-gcc compile options to build in debugging symbols, and it’s often helpful to turn off optimisation if possible by specifying ‘-O0‘ (that’s dash capital “oh” zero). As an example, here’s what I used to build a recent AVR program (fw.c) for debugging:
$avr-gcc -c -g -Wall -O0 -DF_CPU=8000000UL -mmcu=attiny85 -fshort-enums -std=c11 -lm fw.c
$avr-gcc -mmcu=attiny85 -o fw.elf fw.o
$avr-objcopy -j .text -j .data -O ihex fw.elf fw.hex
$avr-size fw.hex
Load your .hex onto the AVR as usual, and connect the Dragon to your computer via USB and AVR via ISP.
Next, we program the AVR’s fuses to enable DebugWIRE support on the micro’s reset pin instead of the usual reset functionality. This allows the Dragon to communicate with the micro via DebugWIRE. This is somewhat risky, in that the reset pin is required to work like a reset pin, not a DebugWIRE pin, during normal programming. So, it’s possible to get into a bad state where you can’t reset or reprogram the micro if for whatever reason your Dragon can’t talk over DebugWIRE… Fortunately, it is possible to use DebugWIRE to change the fuses, which means a nice use for the Dragon is clearing unintentionally-set DebugWIRE fuses!
Anyways, the exact fuse settings will vary depending on the micro model (see handy fuse calculator), and it pays to write down your old fuse settings, but for my attiny85 example, I did:
$avrdude -c dragon_isp -P usb -p attiny85 -U hfuse:w:0x9F:m
Fire up avarice in the background like so:
$avarice -g -w -P attiny85 :4242 &
And, hopefully get a nice output like:
[1] 46459
AVaRICE version 2.13, Dec  1 2015 22:21:32

JTAG config starting.
Found a device: AVRDRAGON
Serial number:  00:a2:00:05:97:02
Reported debugWire device ID: 0x930B
Configured for device ID: 0x930B attiny85 -- Matched with attiny85
JTAG config complete.
Preparing the target device for On Chip Debugging.
Waiting for connection on port 4242.
At this point, the micro should be paused and under the control of the Dragon, we just need to start gdb! I suggest first making a text file to tell gdb that we want it connected to a “remote” session (even though it’s just avrice on a loopback connection). This avoids retyping the same thing every time we start gdb in this particular project:
$echo "target remote localhost:4242" > gdb-init.txt
Which then allows for starting up gdb like this:
$avr-gdb -x gdb-init.txt fw.elf
With any luck, you’ll be presented with a friendly gdb prompt:
GNU gdb (GDB) 7.6.1
Copyright (C) 2013 Free Software Foundation, Inc.
License GPLv3+: GNU GPL version 3 or later <http://gnu.org/licenses/gpl.html>
This is free software: you are free to change and redistribute it.
There is NO WARRANTY, to the extent permitted by law.  Type "show copying"
and "show warranty" for details.
This GDB was configured as "--host=x86_64-apple-darwin14.5.0 --target=avr".
For bug reporting instructions, please see:
<http://www.gnu.org/software/gdb/bugs/>...
Reading symbols from /Users/irees/Projects/CoilWinder/firmware/unspooler_test/fw.elf...done.
Connection opened by host 127.0.0.1, port 56679.
0xfffffffe in ?? ()
(gdb)
Note that the “Connection opened by…” line came from our backgrounded avarisp process.
So, now we’re in a debugger, and can for instance start the program running (“c <enter>” to continue, then CTRL+c to interrupt), set a breakpoint (“b fw.c:123 <enter>” to add a breakpoint on line 123 of fw.c), look at variables (“p someVariable <enter>”), etc. Pretty cool!
Once you’re done debugging and want to put the micro back to normal, exit gdb (this should also kill avarisp) and do something much like earlier where we enabled DebugWIRE, but with one subtle change. The Dragon can be used in multiple modes with avrdude, now that the micro has DebugWIRE enabled, we’ll want to do something like this to restore the original fuse settings (we use dragon_dw vs dragon_isp here – the Dragon also supports JTAG for bigger micros):
$avrdude -c dragon_dw -P usb -p attiny85 -U hfuse:w:0xDF:m
I’ve noticed that sometimes I need to power cycle both the dragon and AVR at the same time when transitioning between normal and DebugWIRE modes, but otherwise the process seems pretty consistent. Have fun!